Using Deep Neural Networks to Analyze Specification Support and Automate the Creation of Specification Support Charts
As an initial introduction into using deep neural networks to streamline patent practice, I will look at perhaps the most straight forward use case -- analyzing specification support for claims of a single patent.
In my prior article, What do Contingent Fee Lawyers Look for When Considering Specification Based Defenses? I discussed the importance of “35 USC 112(a): The Written Description and Enablement of the Invention.” As noted in that post:
"To satisfy the written description requirement, a patent specification must describe the claimed invention in sufficient detail that one skilled in the art can reasonably conclude that the inventor had possession of the claimed invention. … An applicant shows possession of the claimed invention by describing the claimed invention with all of its limitations using such descriptive means as words, structures, figures, diagrams, and formulas that fully set forth the claimed invention." MPEP 2163.
Generally, the claim language must be supported and enabled by the written description of the patent.
The process of analyzing specification support can be streamlined using deep neural networks.
Using Deep Neural Network Sentence Encoders to Identify and Visualize Specification Support for Patent Claims.
As initially noted in my prior article, "Using Deep Neural Networks to Streamline Patent Prosecution and Litigation Tasks," a sentence encoder can be used to compare the meaning of one sentence to another. For determining the specification support for claims of a patent, the meanings of the claim terms will be compared with the meanings of each of the sentences or paragraphs in the specification.

Each claim element of a patent can be compared to each sentence in the specification to determine the portions of the specification that best support the particular claim element.
The claim elements and the specification sentences or paragraphs are converted to separate vectors, encoded using the deep neural network, and then an inner product of the resulting vectors is taken to create a matrix. This matrix can be easily converted into a heat map for visualization.
As an example, we will analyze Claim 1 of U.S. Patent 6285999 titled "Method for node ranking in a linked database" (sometimes referred to as Google’s “PageRank” Patent).
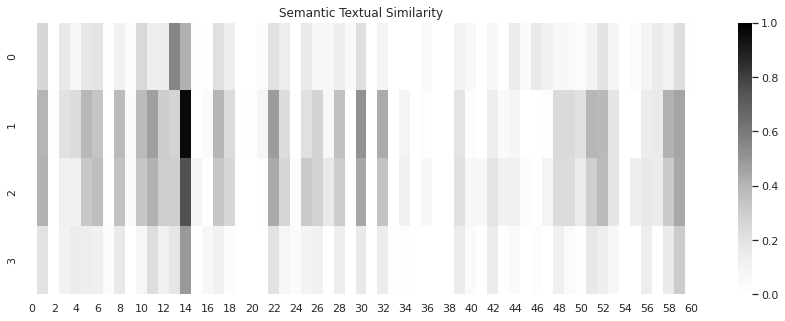
Claim 1 of the patent has four elements, and the specification has 60 paragraphs as illustrated in the heat map and chart below.

A heat map display can be used to easily visualize where claim elements are supported in the specification.
The ‘999 PageRank Patent Claim 1 elements run vertically on the left side of the heat map (0-3), and the ‘999 PageRank Patent specification paragraphs (0-60) run horizontally along the bottom of the heat map.
The darker the color intersecting cells represent more similarity between the specification and the claim language.
To the extent the heat map does not have a high level of similarity to the claims, it may indicate that there is an issue with specification support for a particular claim or claim element.
Here, the best support for the elements of Claim 1 are clustered near paragraph 14 of the specification. A claim support chart can be automatically generated based on the data used to produce the heat map, as shown below.

A two column claim support chart can be automatically generated using the same data used to produce the heat map.
The claim elements are reproduced in the left hand column, and the corresponding top five most similar portions of the specification are reproduced in the left hand column.
As shown above, claim support or lack thereof under 35 USC 112(a) can be quickly visualized by utilizing a deep neural network sentence encoder. This same information can be used to quickly create drafts of claim support charts.
If you would like to explore this process further, contact JDB IP.


